Introduction
One of the major security concerns with modern-day software applications is their strong dependency on Open Source Software (OSS) libraries. The vulnerabilities in the OSS libraries can be exploited by malicious cyber attacks, and threaten the security of dependent software. With strong dependency on OSS libraries, software applications continue to face malicious attacks due to the vulnerabilities discovered in OSS libraries.
According to
Synopsys Cybersecurity Research Center’s (CyRC)
![]() Open Source Security and Risk Analysis (OSSRA) report in 2021
Open Source Security and Risk Analysis (OSSRA) report in 2021
![]() , 98% of 1546 industry codebases audited rely on OSS libraries and 84% of them are subject to at least one public open source vulnerability, which is a 9% increase compared to 2020. Furthermore, according to Snyk’s
The State of Open Source Security 2020
, 98% of 1546 industry codebases audited rely on OSS libraries and 84% of them are subject to at least one public open source vulnerability, which is a 9% increase compared to 2020. Furthermore, according to Snyk’s
The State of Open Source Security 2020
![]() report, vulnerabilities are found in both direct and indirect dependencies, where the majority of vulnerabilities found in Node.js, Java, and Ruby projects are introduced by indirect dependencies. Therefore, detecting vulnerabilities in OSS libraries through dependency analysis is crucial in preventing security attacks.
report, vulnerabilities are found in both direct and indirect dependencies, where the majority of vulnerabilities found in Node.js, Java, and Ruby projects are introduced by indirect dependencies. Therefore, detecting vulnerabilities in OSS libraries through dependency analysis is crucial in preventing security attacks.
Previous research has focused on studying different scopes to identify vulnerabilities introduced by OSS library dependency. For example, Decan et al. in their 2018 paper
“On the impact of security vulnerabilities in the npm package dependency network”
![]() used the metadata from 610K JavaScript packages to analyze the time and duration of vulnerabilities in those packages introduced by direct dependencies.
used the metadata from 610K JavaScript packages to analyze the time and duration of vulnerabilities in those packages introduced by direct dependencies.
In parallel to Decan’s work, Pashchenko et al. in their paper
“Vulnerable Open Source Dependencies: Counting Those That Matter”
![]() also used metadata to identify vulnerabilities due to dependencies. They published a framework on how to report vulnerable dependencies in OSS with a focus on the 200 most popular Java libraries.
also used metadata to identify vulnerabilities due to dependencies. They published a framework on how to report vulnerable dependencies in OSS with a focus on the 200 most popular Java libraries.
Taking a different approach than identifying vulnerabilities from metadata, in 2020,
Ponta et al.
![]() developed a code-centric, usage-based vulnerable detection tool,
Eclipse Steady
developed a code-centric, usage-based vulnerable detection tool,
Eclipse Steady
![]() , to overcome the inaccurate release versions and unavailable vulnerability information from metadata.
, to overcome the inaccurate release versions and unavailable vulnerability information from metadata.
However, no studies have been done to count for vulnerabilities induced by both direct and indirect dependencies in JavaScript npm packages, especially as 86% of the npm projects are reported to be affected by vulnerabilities from indirect dependencies according to Snyk’s
The State of Open Source Security 2020
![]() report.
report.
Research Questions
There are a handful of studies focusing on vulnerabilities in OSS projects through dependency analysis. The study from
Decan et al.
![]() , introduced in the previous section, inspired our project. We extended their vulnerable dependency study to include vulnerabilites due to three dependency types: vulnerability arising from the package itself (self), vulnerability from one or more direct dependencies (direct), and vulnerabilities from one or more indirect dependencies through a dependency chain (indirect). The study from
Pashchenko et al.
, introduced in the previous section, inspired our project. We extended their vulnerable dependency study to include vulnerabilites due to three dependency types: vulnerability arising from the package itself (self), vulnerability from one or more direct dependencies (direct), and vulnerabilities from one or more indirect dependencies through a dependency chain (indirect). The study from
Pashchenko et al.
![]() built up a framework to trace the vulnerabilities through direct and indirect dependency, which we adopted in our study as the ground work.
built up a framework to trace the vulnerabilities through direct and indirect dependency, which we adopted in our study as the ground work.
Our overall goal for this project was to perform empirical research and vulnerable dependency analysis of popular OSS projects and libraries within the npm ecosystem, with the following specific research questions:
- Which aspects and metrics should be considered when determining the popularity of npm OSS packages?
- How many vulnerable npm packages should we consider for our research study and why?
- Analyzing vulnerabilities in popular vulnerable npm packages to find out:
- When are vulnerabilities discovered, and what are their distributions with respect to vulnerability dependency types and severity levels?
- Which packages are immediately vulnerable, and what are their distributions with respect to vulnerability dependency types and severity levels?
- What are the most frequent vulnerability types and severity levels in all package releases and most recent release?
Contributions
Our project adopts an empirical approach in identifying and analyzing the vulnerabilities occurring in JavaScript npm packages through both direct and indirect dependencies, with the following contributions:
- We identified unique metrics to account for both technical and social influence in determining the popularity of npm packages.
- We determined the top 2,000 packages to represent the most-influential npm packages since vulnerabilities found in these packages will have a widespread impact.
- We highlighted the vulnerabilities among top 2,000 npm packages and their past releases based on
- Vulnerability discovery time: Whether the vulnerability in a dependency of the package was published before or after the release of that package. If the vulnerability in the dependency was published before the release of the package, then the package is said to be immediately vulnerable.
- Vulnerability dependency: if the vulnerability is within the package itself (self), directly depending on a vulnerable package (direct), or depending on a vulnerable package through a dependency chain (indirect).
- Vulnerability types and severity levels (critical, high, medium, or low).
Background
The project goal of investigating the chain of vulnerabilities in popular OSS software drove us to research the three relevant sub-areas for literature review, specifically,
- What are the metrics used in the previous study to evaluate the popularity of an OSS software?
- What frameworks have been established to trace vulnerabilities through dependency analysis?
- What vulnerability studies have been conducted specifically for npm ecosystem?
The very first task in our study is identifying popular packages. However, it is not trivial to decide which popularity metrics to consider since there are diverse criteria of popularity. As a case study,
Zerouali et al.
![]() computed Spearman (ρ) correlation factors between 9 different popularity metrics for a large dataset of 175K npm packages. Indeed, they found that many popularity metrics are not strongly correlated (ρ = 0.57), which implies that the use of different metrics may produce different outcomes. This result clearly shows that the context of popularity should be considered when we select popularity metrics for a specific study.
computed Spearman (ρ) correlation factors between 9 different popularity metrics for a large dataset of 175K npm packages. Indeed, they found that many popularity metrics are not strongly correlated (ρ = 0.57), which implies that the use of different metrics may produce different outcomes. This result clearly shows that the context of popularity should be considered when we select popularity metrics for a specific study.
One of the most important aspects of our research is understanding how to properly define vulnerable open source dependencies and how to use a precise, constructive and empirical approach to vulnerability measurement. The research by
Pashchenko at al.
![]() addresses this concern by considering source data not just from repositories, but also from analyzing build and testing information, patch updates, etc. The study emphasized a focus on OSS usage in industry, where 80% of average commercial project consists of OSS, and 20% of dependencies with known vulnerabilities are not deployed. The methodology and data used in this study is language-agnostic and only relies on availability of dependency management system, such as Maven (Java), PIP (Python), NPM (Javascript), etc. Their results apply not only to Maven but equally well for npm data. They considered 10,905 distinct GAV (group, artifact, version) data nodes. The results show that of all vulnerabilities found, a significant number (1 in 5) is never deployed to production. Regarding who is responsible for (and can potentially fix) the vulnerabilities, their study indicates that the source comes from direct and own dependencies, which are upon developers to actually fix the security issues. In addition, transitive dependencies with halted development have the highest cost associated with finding and fixing the vulnerabilities. These results from the study shows the importance of an accurate, methodical and empirical vulnerability measurement for OSS projects as well as to developers and companies.
addresses this concern by considering source data not just from repositories, but also from analyzing build and testing information, patch updates, etc. The study emphasized a focus on OSS usage in industry, where 80% of average commercial project consists of OSS, and 20% of dependencies with known vulnerabilities are not deployed. The methodology and data used in this study is language-agnostic and only relies on availability of dependency management system, such as Maven (Java), PIP (Python), NPM (Javascript), etc. Their results apply not only to Maven but equally well for npm data. They considered 10,905 distinct GAV (group, artifact, version) data nodes. The results show that of all vulnerabilities found, a significant number (1 in 5) is never deployed to production. Regarding who is responsible for (and can potentially fix) the vulnerabilities, their study indicates that the source comes from direct and own dependencies, which are upon developers to actually fix the security issues. In addition, transitive dependencies with halted development have the highest cost associated with finding and fixing the vulnerabilities. These results from the study shows the importance of an accurate, methodical and empirical vulnerability measurement for OSS projects as well as to developers and companies.
The dependency across npm packages can be clearly illustrated in a simple graph. However, the characteristics of such framework was not well studied until
Zimmermann et al.
![]() presented their research on the global property of the dependency graph in npm ecosystem and the relation with vulnerabilities. The result showed that the dependency across npm packages is increasing super-linearly with time, and the distribution of dependency number is nearly exponential. This result proved that highly popular packages have the dominate influence on npm ecosystem. They also discovered a moderate correlation between dependency and vulnerabilities. Because of such significant difference between popular packages and ordinary packages, we computed such correlation between the dependency and vulnerabilities within the realm of popular packages.
presented their research on the global property of the dependency graph in npm ecosystem and the relation with vulnerabilities. The result showed that the dependency across npm packages is increasing super-linearly with time, and the distribution of dependency number is nearly exponential. This result proved that highly popular packages have the dominate influence on npm ecosystem. They also discovered a moderate correlation between dependency and vulnerabilities. Because of such significant difference between popular packages and ordinary packages, we computed such correlation between the dependency and vulnerabilities within the realm of popular packages.
Vulnerabilities spread between software packages through dependencies. One of the vulnerability studies done in the npm ecosystem by
Decan et al.
![]() surveyed 610K JavaScript packages to analyze how and when different vulnerabilities are discovered and fixed in the npm package dependency network, and to what extent do they affect other packages. The study reveals that it takes more than 2 years to discover 50% of the vulnerabilities, and an even longer time to discover low severity ones. In addition to the delay in detecting vulnerabilities, they concluded that more than 33% of affected dependent packages are not updated even if an upstream fix is available because of restrictive dependency constraints. We extended these aspects of their study by analyzing how vulnerable npm packages affect directly and indirectly dependent packages.
surveyed 610K JavaScript packages to analyze how and when different vulnerabilities are discovered and fixed in the npm package dependency network, and to what extent do they affect other packages. The study reveals that it takes more than 2 years to discover 50% of the vulnerabilities, and an even longer time to discover low severity ones. In addition to the delay in detecting vulnerabilities, they concluded that more than 33% of affected dependent packages are not updated even if an upstream fix is available because of restrictive dependency constraints. We extended these aspects of their study by analyzing how vulnerable npm packages affect directly and indirectly dependent packages.
Methodology
Study Design
We designed the experiment by first finding the most important packages within the npm ecosystem, and then investigating the vulnerabilities in the selected packages.
Identifying important packages
There are various popularity metrics for packages, making it challenging to decide what metrics should be used to select popular packages. Although those metrics show moderate correlation (p = 0.57), each can be interpreted from a different point of view, and can also be measured in a different way. Therefore, we combined both social aspect (e.g. the number of stars, forks and watchers on GitHub) and technical aspect of popularity (e.g. download count and number of depending packages) to avoid any possible bias.
Identifying Vulnerabilities and Dependency Analysis
Given a list of important packages, we searched for vulnerabilities by the name of each package on
Snyk Advisor
![]() . For npm, Snyk reports vulnerabilities not only in that very package and direct dependencies, but also transitive dependencies over all the versions published within npm. Vulnerabilities found are then categorized by the vulnerability types and severity levels for further analysis.
. For npm, Snyk reports vulnerabilities not only in that very package and direct dependencies, but also transitive dependencies over all the versions published within npm. Vulnerabilities found are then categorized by the vulnerability types and severity levels for further analysis.
Data Collection
For this project, we explored various sources of data, including
Libraries.io
![]() ,
npm
,
npm
![]() ,
GitHub
,
GitHub
![]() and
Synk Vulnerability Database
and
Synk Vulnerability Database
![]() , to investigate packages dependencies and vulnerabilities in the published packages within npm.
, to investigate packages dependencies and vulnerabilities in the published packages within npm.
Libraries.io and npm
Open Source Repository and Dependency Metadata dataset, or
Libraries.io
![]() , includes metadata of packages (package name, version, list of dependencies, etc.) from 34 different package managers. We filtered data for packages published in npm to extract the required dependencies for them. This allowed us to investigate the relationships among packages without manually extracting information from json manifest file that stores the metadata of each npm package. In addition to Libraries.io, we utilized
npm
, includes metadata of packages (package name, version, list of dependencies, etc.) from 34 different package managers. We filtered data for packages published in npm to extract the required dependencies for them. This allowed us to investigate the relationships among packages without manually extracting information from json manifest file that stores the metadata of each npm package. In addition to Libraries.io, we utilized
npm
![]() as the source by querying all release metadata, including release name and timestamp, for each package of interest.
as the source by querying all release metadata, including release name and timestamp, for each package of interest.
GitHub
Based on the data filtered for npm packages, we extracted GitHub stars, forks and watchers using GitHub APIs. We combined these metrics to account for the social influences in selecting popular npm packages for vulnerability analysis.
Snyk Vulnerability Database
We explored
Snyk Vulnerability Database (Snyk DB)
![]() for identifying vulnerabilities in npm packages. The database allows users to use package name and optionally with package release name to search for known vulnerabilities in that package. To pipeline the querying process from Snyk, we developed an extractor in Python to search a given npm package’s vulnerability with package name, version, and GitHub URL through
Snyk Command Line Interface (CLI)
for identifying vulnerabilities in npm packages. The database allows users to use package name and optionally with package release name to search for known vulnerabilities in that package. To pipeline the querying process from Snyk, we developed an extractor in Python to search a given npm package’s vulnerability with package name, version, and GitHub URL through
Snyk Command Line Interface (CLI)
![]() tool.
tool.
Variables Considered
The two main tasks of the project, i.e. identifying popular npm packages and investigating their vulnerabilities, are concerned with different sets of variables and attributes from the data extracted. In order to extract popular npm packages from the Libraries.io dataset, we considered their direct dependent package list, to examine the technical influence of each package. We also developed a tool to extract each package’s stars, forks and watchers from their GitHub repositories to examine their social influence.
To analyze the vulnerability of each popular package, specifically the vulnerability dependency types and discovery time, we divided the vulnerability information extraction into two phases. First, for all popular packages and their past releases, we scanned their basic vulnerable data by querying from Snyk whether a package release was vulnerable, their number of vulnerabilities, and the count of critical, high, medium, low severity vulnerabilities, if present. Then, for the releases that has vulnerabilities recorded, we further extracted detailed vulnerable attributes, including the disclosure and publication time of the vulnerabilities, the dependency path tracing back to the problematic source package, and the release name when the vulnerability was fixed.
Analysis Methods
To compare the different metrics in searching for the ones that can best represent the social and technical aspect of the npm packages, we adopted the methods in the research of Zerouali et al. which computed Pearson (R) and Spearman (ρ) correlation factors across different popularity metrics. Using the threshold cutoff relation of 0 < very weak ≤ 0.2 < weak ≤ 0.4 < moderate ≤ 0.6 < moderately strong ≤ 0.8 < strong ≤ 1, we compared the similarities between the candidate metrics to decide if the correlation between any metric is strong enough to demonstrate the influence of the packages.
Our analysis of vulnerabilities in a package can be divided into several steps: if the package has any vulnerabilities, then finding the discovery time of such vulnerabilities, the type of vulnerable dependency, and the severity level. To check if the package and its release have any vulnerabilities, we first queried the vulnerability in a form of json file from Snyk using the package name and its release we obtained from npm, and extracted the value of ok in the json to determine if any vulnerability was recorded.
For every vulnerability found, the discovery time of each can be associated by either disclosureTime, the time the vulnerable was first disclosed, or publicationTime, the time the vulnerable was publicly announced. In our research, we adopted the publicationTime instead of disclosureTime since the former is a more accurate measure of when a release is publicly known to be vulnerable than the latter. The vulnerability dependency type can be analyzed by the node from which listed the source of vulnerability through the dependency. If from has only one package, then the vulnerable dependency comes from the package itself. Similarly, if from has two packages, then vulnerability arises from direct dependencies too, while more than two packages indicates the vulnerability in a release arises from indirect dependencies as well. Lastly, the severity of the vulnerability is highlighted by the node severity in Snyk DB, ranging from critical, high, medium, to low. Once all these attributes are tabulated for each vulnerability in all packages, we aggregated the statistics using histograms and box plots to answer RQ3.
Results
RQ1: Which aspects and metrics should be considered when determining the popularity of npm OSS packages?
Popularity can be defined and measured in various ways. Thus, each study needs to rely on study-specific popularity metrics considering the context of popularity. In our project, we investigated both technical and social aspects of popularity and selected one metric from each aspect. Finally, we derived the top $N$ popular packages by combining these two different metrics.
Technical aspect
The more dependents packages have, the greater effect their vulnerabilities. This is because a package’s vulnerability can be disseminated throughout their dependents. In this context, the number of dependents is one of the important metrics in the technical aspect of popularity in our project. However, simply using this as a metric may fall into a pitfall since it does not take the chain of dependencies into account.
For example, let’s consider a 8-node dependency graph. In the figure below, each node represents a package, and an edge from package u to package v represents that u is a dependent of v. The example graph shows that the number of dependents only captures the direct neighbors of each node, thus implicitly important packages may have low values. Although the in-degree, which is the number of dependents, of package A is only 1, it is clear that executing any of packages B, D, E, F, G and H results in executing package A.
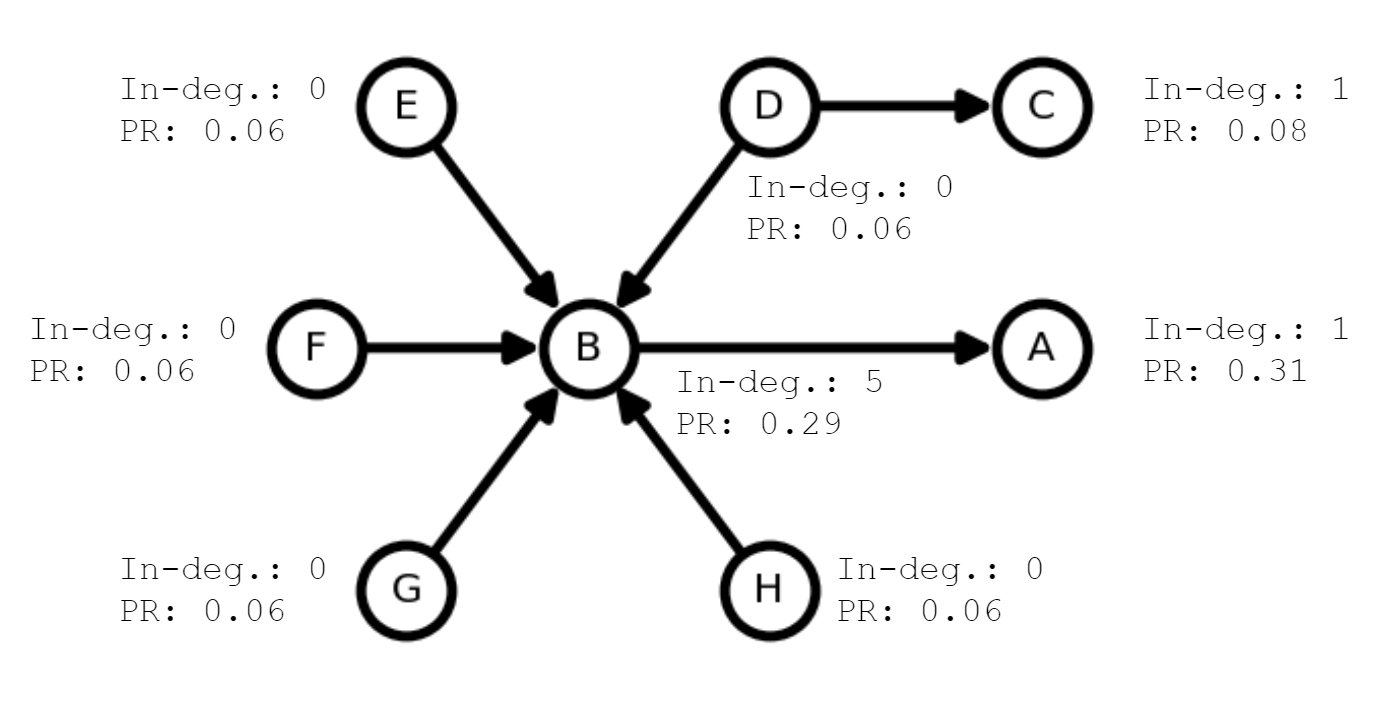
8-node dependency graph
To take transitive dependency into account, we computed
PageRank
![]() of the dependency graph. The PageRank algorithm gives more weight on the edge of relatively important nodes. Thus, in the above figure, even if package A has only one dependent package B, package A has the highest PageRank since its dependent has many other dependents.
of the dependency graph. The PageRank algorithm gives more weight on the edge of relatively important nodes. Thus, in the above figure, even if package A has only one dependent package B, package A has the highest PageRank since its dependent has many other dependents.
We measured Pearson (R) and Spearman (ρ) correlation coefficient between dependent projects count and PageRank of packages. We observed strong non-linear correlations between them (ρ = 0.40, R = 0.87) and decided it is high enough to select one metric on behalf of the other one. Thus, PageRank is finally selected as a single metric for the technical aspect of popularity metric.
Social aspect
Al-Rubaye et al.
![]() surveyed several mechanisms for scoring popularity among GitHub repositories. They mention starring, forking and watching repositories as the most common mechanisms for liking content and providing social media style interactions on GitHub. Thus, in context of social aspects, we used these metrics to measure popularity.
surveyed several mechanisms for scoring popularity among GitHub repositories. They mention starring, forking and watching repositories as the most common mechanisms for liking content and providing social media style interactions on GitHub. Thus, in context of social aspects, we used these metrics to measure popularity.
We measured the Pearson (ρ) and Spearman (R) correlation coefficients for the number of watchers, forks and stars. The table below shows the correlations for these GitHub popularity metrics.
| #watchers | #forks | #stars | |
|---|---|---|---|
| #watchers | ρ = 1.00 R = 1.00 |
ρ = 0.76 R = 0.92 strong |
ρ = 0.91 R = 0.91 strong |
| #forks | ρ = 1.00 R = 1.00 |
ρ = 0.79 R = 0.96 strong |
|
| #stars | ρ = 1.00 R = 1.00 |
Pearson and Spearman correlation coefficients for GitHub popularity metrics
We observed strong linear correlations between the three popularity metrics. Therefore, we decided to only use the number of stars to determine the top-N popular packages.
RQ2: How many vulnerable npm packages should we consider for our research study and why?
To determine the count of the top npm packages for our study, we closely examined the distribution of the two popularity metrics, PageRank and Github repository stars.
Starting with PageRank, the left graph in the figure below shows the calculated PageRank value with respect to the corresponding package rank. The PageRank value demonstrates a beyond exponential decrease as the package rank is increasing. Thus, selecting only top 5,000 shown by the vertical red line in the figure, PageRank packages is sufficient for covering the popular package from the technical aspect.
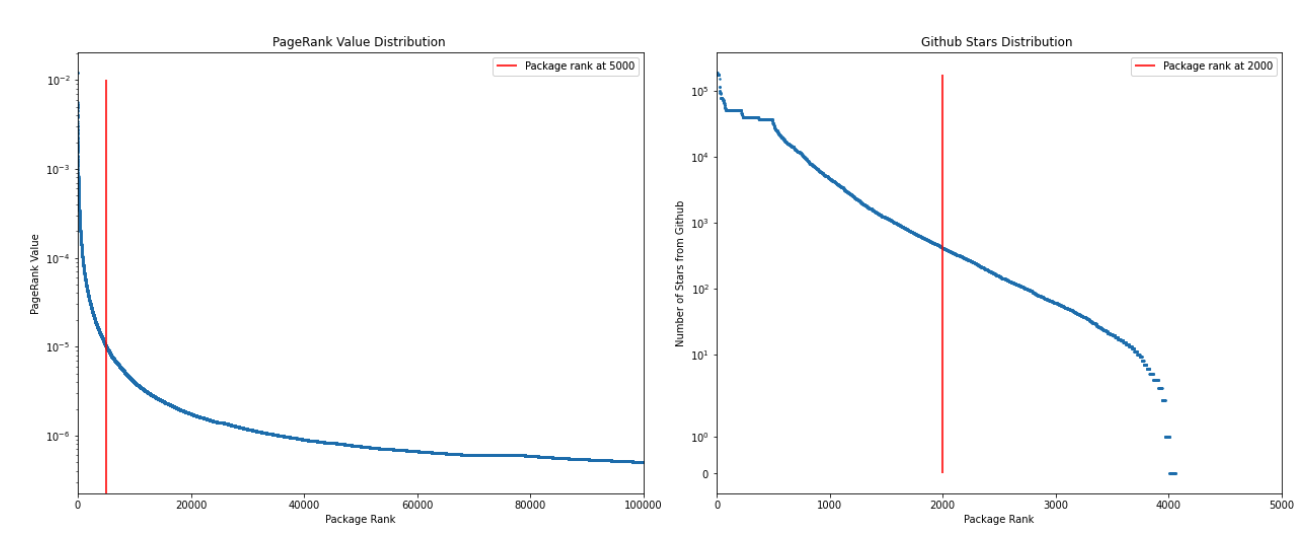
PageRank (left) and GitHub stars (right) distribution with respect to Package's Popularity Rank
We fetched GitHub repositories for the top 5,000 packages ranked by PageRank and sorted the package list again to account for the social influence of the package. Similar to the PageRank, the distribution of packages' GitHub star number in the right of the figure declined exponentially as the package order increases. As highlighted by the red vertical line in the same plot, choosing N = 2,000 as a threshold can capture the popular npm packages from both technical and social perspective, while keeping the dataset in a reasonable size.
RQ3: Analyzing vulnerabilities in popular vulnerable npm packages
The top 2,000 npm packages selected yields 231,488 releases in total, with the earliest dated back to 2010. Among these, 60.6% releases do not have known vulnerabilities, 38.8% have one or more vulnerabilities, and 0.695% releases do not have data from Snyk DB. By examining the data that does not have record at Snyk DB, we discovered that these are either old or preview releases and does not concern with our purpose of study, and thus the 0.695% , or 1609 releases, was removed from our data.
Between the packages with vulnerabilities, there are in total 864 packages and 89,658 releases, resulting in 1,654,568 vulnerabilities for further analysis. The sections 4.3.1 through 4.3.3 address the study of scanning vulnerability discovery time, zooming into immediate vulnerable, and ranking the top vulnerable types and severity levels.
When are vulnerabilities discovered, and what are their distributions with respect to vulnerability dependency types and severity levels?
We first began by surveying the vulnerability type of all 1,654,568 vulnerabilities to decide if the vulnerability was introduced within the package itself (self), from a directly dependent package (direct), or from depending on a vulnerable root package through a chain (indirect). The statistics revealed that most vulnerabilities (75.4%) were introduced from indirect dependency, with the rest 18.5% from direct dependency, and only a small portion (6.19%) was from package itself.
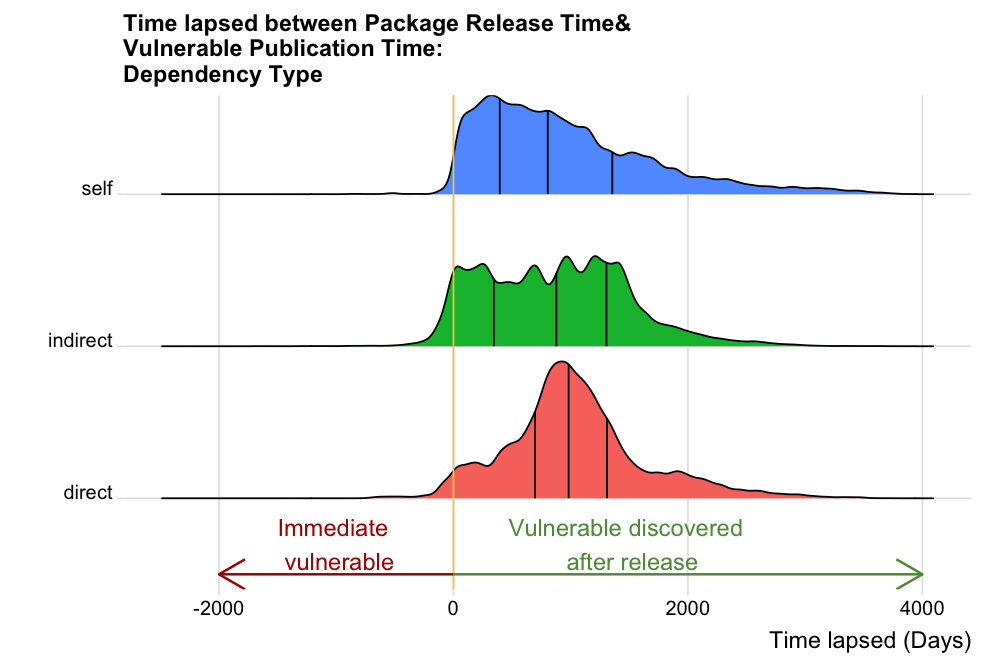
Vulnerable discovery time based on dependency type
To determine when the vulnerabilities were discovered, we calculated the time lapsed between the release time of a vulnerable package and the publication time of the corresponding vulnerability in days, and plotted it against the vulnerability dependency type of self, direct, or indirectly depending on a vulnerable root package in the figure above. Most vulnerabilities were discovered after the release of the package, as the time lapsed between package release and vulnerable publication is positive. As the figure uncovers, the discovery time of vulnerabilities shows different patterns based on dependency type: for packages that have vulnerabilities within themselves, it took shorter time to discover those vulnerabilities, compared to those which have vulnerabilities due direct or indirect dependencies. The time to catch vulnerabilities due to indirect dependencies can range from one to nearly 3,000 days, while the time to detect and publish a vulnerability from direct dependency peaked around 1,000 days. Only a small portion of vulnerabilities are immediately vulnerable with negative time lapsed, and will be discussed in detail in the next section.
Vulnerable discovery time based on dependency type
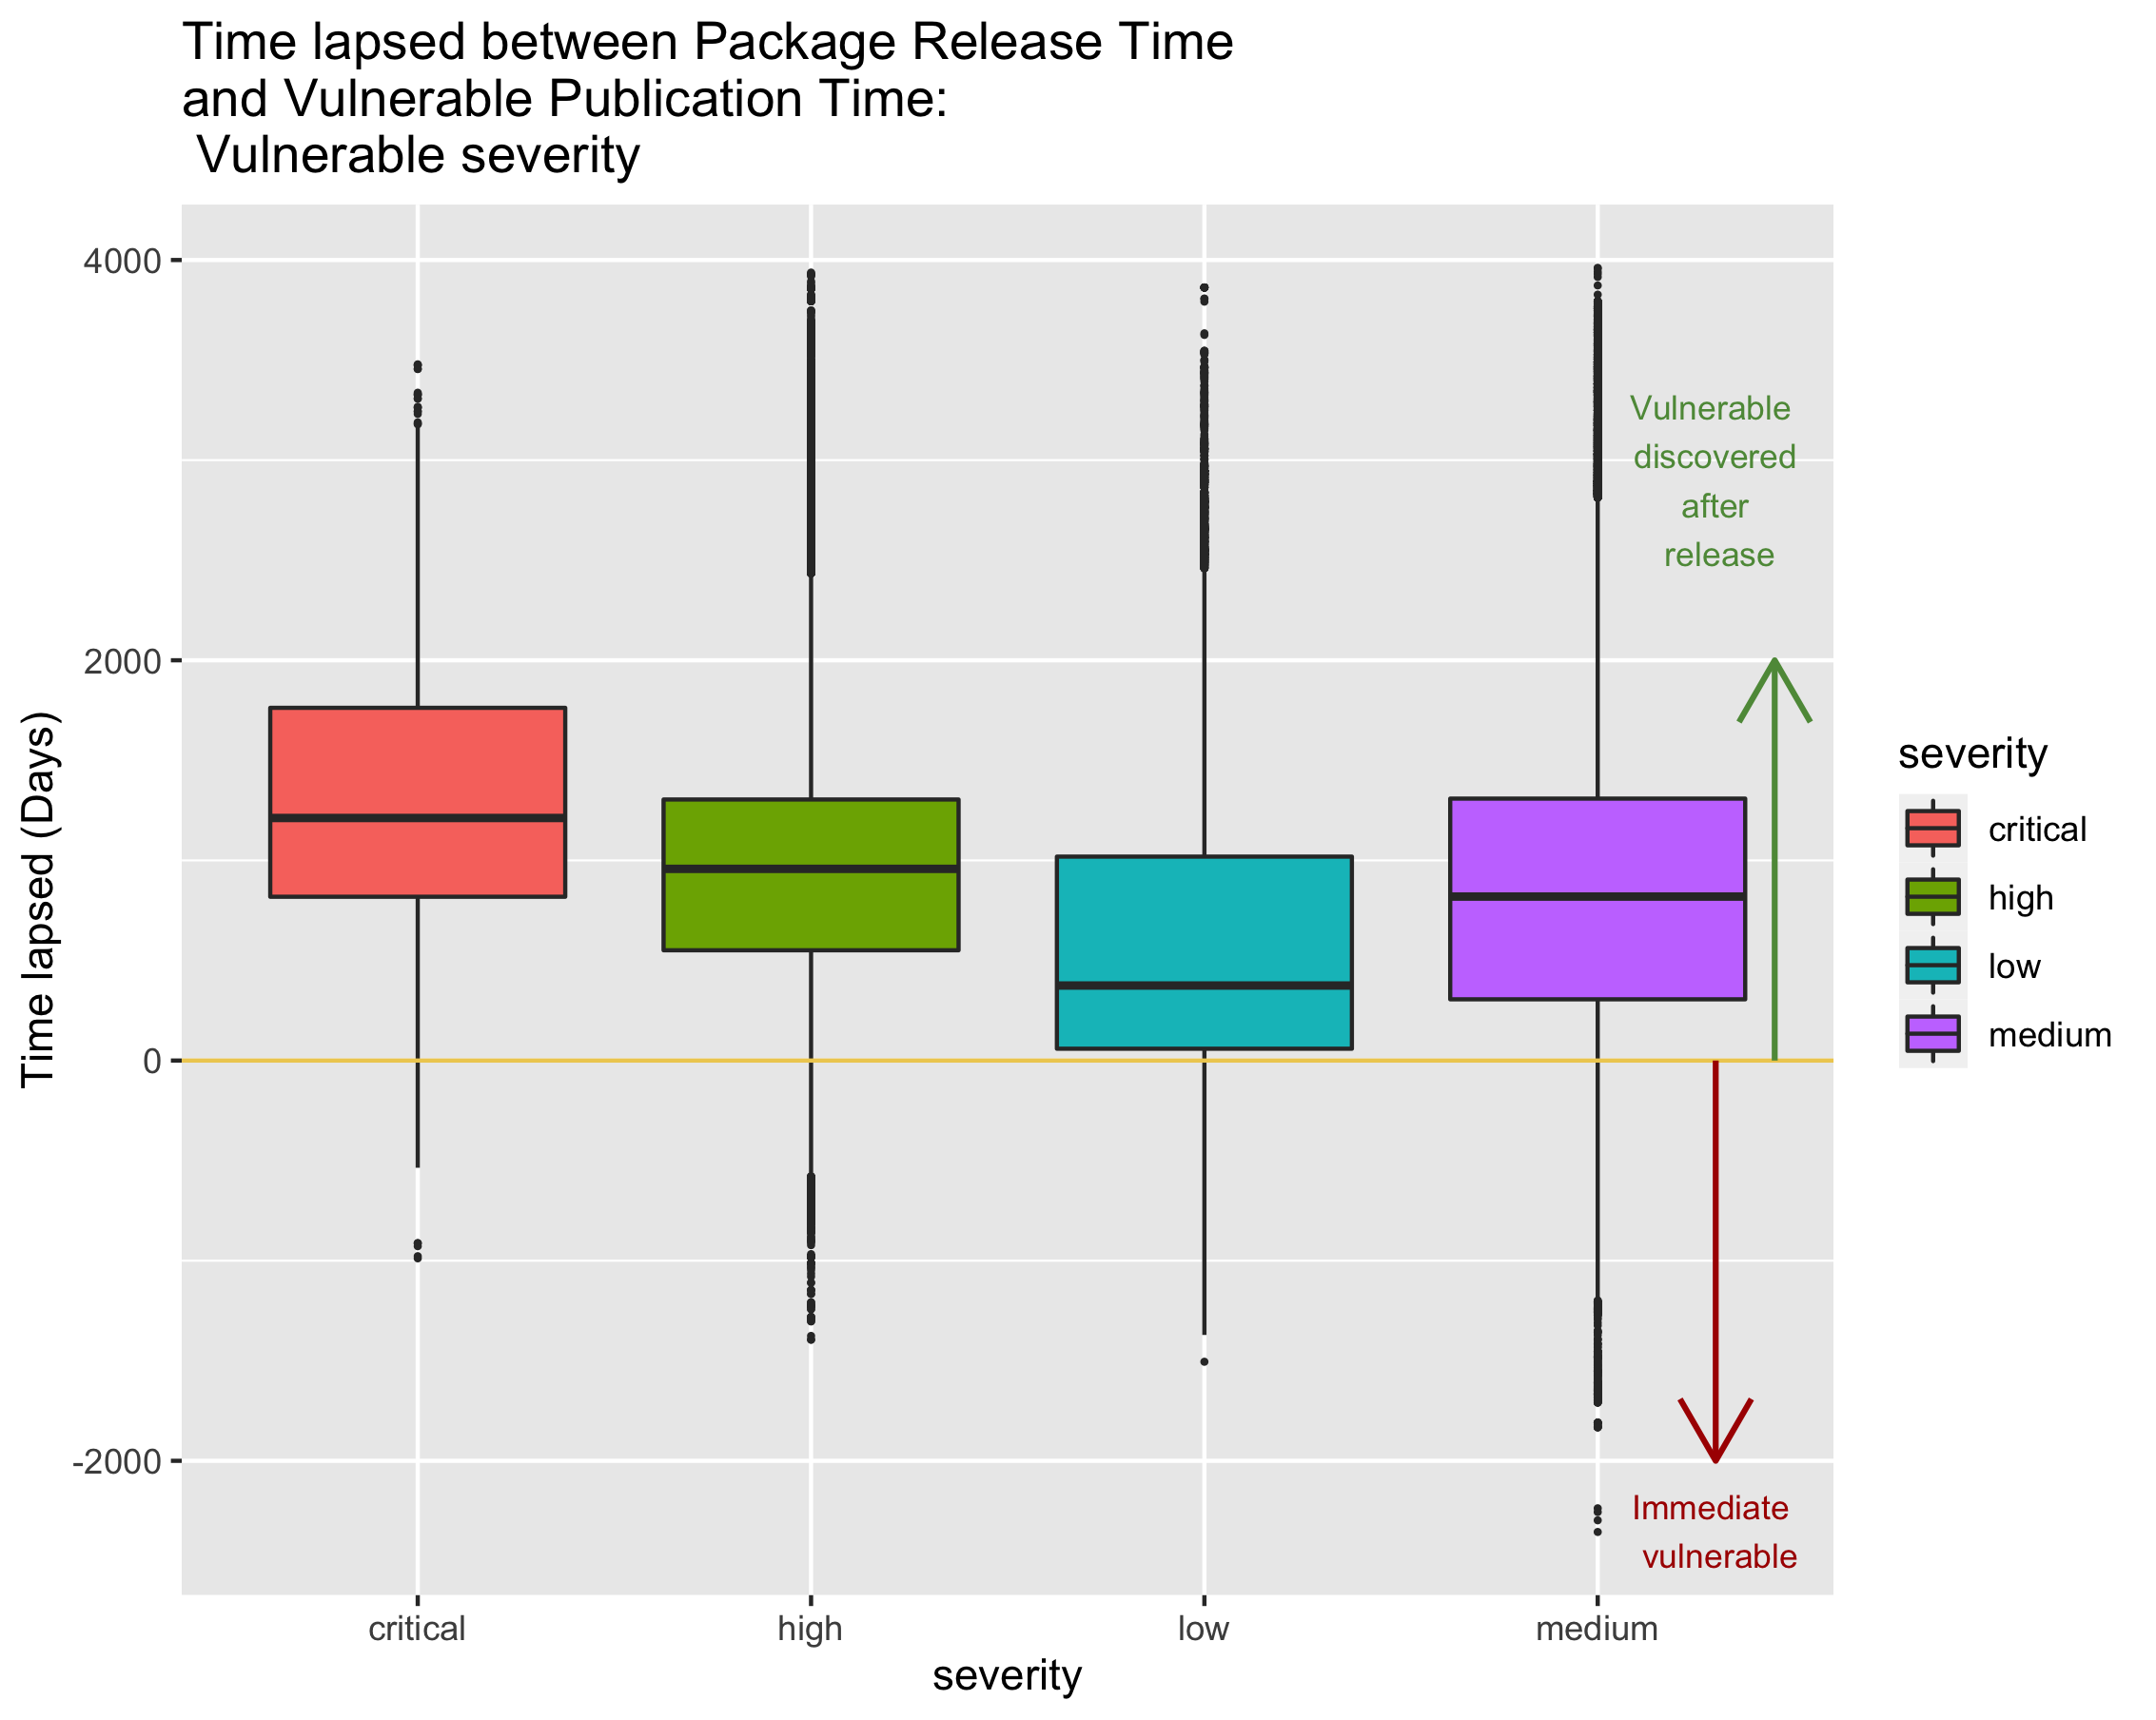
In addition to examining the vulnerability discovery time with respect to the dependency type, we further studied the discovery time from the perspective of vulnerability severity level, as shown in the above figure with a box plot. Note that there are no significant difference in vulnerability discovery time based on severity, with relatively shorter discovery time in severity vulnerabilities.
Which packages are immediately vulnerable, and what are their distributions with respect to vulnerability dependency types and severity levels?
Through this question, we aimed to understand how many packages are immediately vulnerable, i.e. a vulnerability had already been found and published in a direct or indirect dependency at the time of the release. We also analyzed how many of such immediately vulnerable packages have vulnerabilities due to direct and indirect dependencies.
Of all the vulnerabilities that we analyzed, we found that 82,777 (5% of the 1,654,568 vulnerabilities) can be considered immediate vulnerabilities. Of these immediate vulnerabilities, a large majority (74,258 out of 82,777 or 89.71%) are caused by indirect dependencies and only a small percentage (7,177 out of 82,777 or 9.32%) due to direct dependencies. The figure below shows the number of days before the release of a package when a vulnerability was published in its dependencies. We can see that most immediately vulnerable releases are using dependencies in which vulnerabilities have been published within 6 months before the release. Interestingly, there are some immediately vulnerable releases that have used dependencies where vulnerability was published ~6.5 years ago.
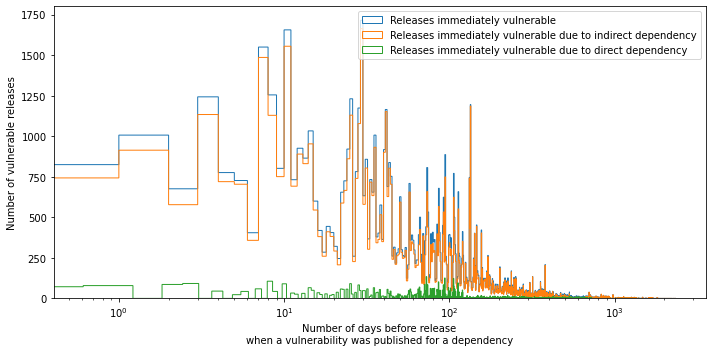
Immediately vulnerable releases based on dependency type
The table below shows the severity levels of vulnerabilities found in all immediate vulnerabilities. We observed that majority of the vulnerabilities were of medium severity, around a quarter were of high severity and a very small fraction were of critical severity.
| Severity | Vulnerabilities | Percentage |
|---|---|---|
| Low | 13,826 | 16.70% |
| Medium | 49,105 | 59.32% |
| High | 19,123 | 23.10% |
| Critical | 723 | 0.87% |
| Total | 82,777 | 100.00% |
Severity levels of vulnerabilities in immediately vulnerable releases
What are the most frequent vulnerable types and severity levels, in all package releases and most recent release?
Based on the 1,654,568 vulnerabilities analyzed, for both all past releases and the most recent release, we summarized the most frequent types of vulnerabilities in the table below. Interestingly, both most recent releases and all past releases share the same set of the most frequency vulnerability types:
- Regular Expression Denial of Service (ReDoS)
- Prototype Pollution
- Arbitrary Code Injection
and the majority of vulnerabilities across both datasets are in medium severity level.
| Most Frequent Vulnerability Types | All Releases | Most Recent release |
|---|---|---|
| Regular Expression Denial of Service (ReDoS) | 39.8% | 19.3% |
| Prototype Pollution | 23.8% | 9.30% |
| Arbitrary Code Injection | 7.34% | 56.5% |
Most frequent vulnerable types in all releases and most recent release
| Severity | All Releases | Most Recent Release |
|---|---|---|
| Low | 4.25% | 3.52% |
| Medium | 50.6% | 75.1% |
| High | 43.0% | 20.2% |
| Critical | 2.21% | 1.15% |
Most frequent vulnerability severity levels in all releases and most recent releases
In addition to the most frequent types and severity level of the vulnerabilities, we noticed some very interesting trends and outliers worth highlighting. Across all of the severity levels, the percentage of vulnerabilities that can be fixed by upgrading the vulnerable packages is highest for critical vulnerabilities (79%) and low-severity vulnerabilities (77%) while medium and high severity packages can only be fixed by upgrading 61% and 67% of vulnerable packages, respectively. Also we found that for critical severity packages, for every 438 vulnerabilities fixed there is 1 vulnerability that is not fixed. For non-critical packages, that ratio drops to an average of 1 vulnerability not fixed for every 21 vulnerabilities fixed, which is a quantifiably big difference on the attitude and importance given to critically vulnerable packages in the open source community.
Discussion
Main Results and Implications
Our project identified a unique metric to address both technical and social influences of packages in the npm system. By measuring Pearson (R) and Spearman (ρ) correlation coefficient between several metrics, we selected PageRank and GitHub stars to represent the technical and social impact of npm packages, and ranked 2,000 popular packages accordingly for vulnerability study.
Our research studied top 2,000 npm packages and their vulnerabilities in past releases, from the perspectives of vulnerability discovery time, vulnerability dependency type, vulnerable types and severity. RQ3.1 reveals that most vulnerable were made to public after the packages were released, and a majority (75.4%) of vulnerable were introduced through indirect dependency. As the result for RQ3.2 highlighted, 5% of the vulnerabilities are immediately vulnerable, as the vulnerabilities was published mostly within 6 months before the packages were released. Lastly, RQ3.3 pointed out that both past releases and the most recent release share the same set of the most frequency vulnerability types:
- Regular Expression Denial of Service (ReDoS)
- Prototype Pollution
- Arbitrary Code Injection
while the majority of vulnerabilities are at the medium severity level.
Also looking at the packages from the perspective of the type of vulnerability (e.g. Cross-site Scripting (XSS), Arbitrary Code Injection, etc.), we found that vulnerability types of HTTP Header Injection takes the longest to fix (2,767 days) followed by Arbitrary Code Injection (2,554 days), Improper Access Control (2,360 days), Remote Code Execution (RCE) (2,165 days) and Cross-Site Request Forgery (CSRF) (2,062 days).
The five most common vulnerability types that have the most options of being fixed by upgrading the vulnerable packages include Regular Expression Denial of Service (ReDoS), Prototype Pollution, Use After Free (UAF), Arbitrary Code Injection and Denial of Service (DoS).
For open source packages, we can see that certain packages with vulnerabilities are not prioritized and fixed as efficiently as others. For example, certain outliers aside, NULL Pointer Dereference, Arbitrary File Write via Archive Extraction (Zip Slip), Uncontrolled Recursion, Out-of-bounds Read and Improper Input Validation are the worst maintained packages from the perspective of vulnerabilities being detected and not fixed with 300, 153, 84, 72 and 31 vulnerabilities not fixed for every vulnerability detected and fixed, respectively.
The results of our vulnerability study have implications to both individual developers and npm community. For developers, it is important to notice that most vulnerabilities in project can be introduced through indirect dependency. Dependencies should be selected more carefully after a quick research of package vulnerability through public database, and immediate vulnerable packages should be avoided in the current project. However, security cannot be maintained through only individual effort, as projects cannot avoid dependencies and new vulnerabilities can be detected any time after the package was released. For packages that has vulnerabilities tracing through a long dependency chain, fixing such vulnerabilities can be difficult and costly for individuals. Therefore, we should raise the awareness of vulnerabilities introduced through indirect dependencies, and make collective efforts to address such issue in the npm community.
Strength and Limitations
Our project presented unique metric to account for technical and social influences of npm packages, and conducted extensive study of the vulnerabilities among all 1.6M releases in the popular packages. We extended the prior research on vulnerability dependency by examining vulnerabilities not only due to self and direct dependencies, but also indirect dependency tracing back to root vulnerable packages. In addition to the dependency study, our results identified immediately vulnerable releases, and highlighted the most frequent vulnerability types in the release data, which provides good reference to researchers and developers who are interested in npm package development security and vulnerability trend study.
Despite the great implications from results, our study is subject to limitations. Since we only used npm package data in the process of determining the popularity metrics, our metrics only apply to npm, while effectiveness in the context of other ecosystem is not measured. Additionally, our vulnerability analysis was based on popular npm packages, and the results highlighted are restricted to this regime only. Thus, the trend of vulnerability dependency types and frequent vulnerabilities may not apply to all npm packages and other ecosystems.
Future Work
Popularity metrics
As mentioned by
Zerouali et al.
![]() , popularity of packages can be measured in many different ways and each metric represent different points of view for measuring popularity. In our study, we focused on the vulnerabilities in dependency chains and used PageRank of dependency graph and the number of GitHub stars as popularity metrics. In different contexts, however, other metrics can be used to identify popular packages.
, popularity of packages can be measured in many different ways and each metric represent different points of view for measuring popularity. In our study, we focused on the vulnerabilities in dependency chains and used PageRank of dependency graph and the number of GitHub stars as popularity metrics. In different contexts, however, other metrics can be used to identify popular packages.
Cross-source discrepancies
The full dependency data is from Libraries.io while the vulnerability data is from Snyk DB. The difference in data source resulted in a discrepancy between npm package name and version name. Furthermore, the project and dependency data from Libraries.io needs cleaning up for mismatching attributes. To fix this, we introduced a complex function to link the two dataset, but the effect is not good enough as only 47.8% of dependencies between projects are matched. The next step is to either find a reliable source to download the full dependency data and vulnerability data from one dataset (e.g. npm APIs), or to polish the link function.
Package definitions and vulnerability classification
When accessing GitHub and GitHub-derived data from other sources such as libraries.io, Google BigQuery Open Datasets, etc. an interesting pattern emerges - not all packages are listed atomically in a GitHub repository. For example, while airbnb javascript packages eslint-config-airbnb-base and eslint-config-airbnb are listed as two distinct packages in npm, on GitHub they are listed under the same
repository
![]() with the two packages under the same directory
with the two packages under the same directory packages. This is probably due to the fact that these two packages share common code-base. However, it becomes difficult to delineate the popularity, vulnerabilities, activities, etc. between them from GitHub alone, and would require more sophisticated data extraction methodologies combining data from multiple sources to get a more reliable and accurate dataset to work with. This is something that can be considered and incorporated in future iterations.
Dependency study
Our project only focused on vulnerabilities and their dependency relations back to the vulnerable root packages, while the impact of the vulnerabilities in popular packages to its dependents was not studied due to the cost of building such dependency graph. As mentioned by
Zimmermann et al.
![]() , the indirect dependency between projects increases super-linearly, which make the analysis through a complete dependency graph of npm packages hard to proceed. One idea to simplify this time consuming process is pruning. However, the top popular projects are transitively depended on by a fairly large part of all projects, thus the cost of building such big dependency graph is too high for the limited time. We plan to research more optimized graph search algorithms to speed up the graph analysis.
, the indirect dependency between projects increases super-linearly, which make the analysis through a complete dependency graph of npm packages hard to proceed. One idea to simplify this time consuming process is pruning. However, the top popular projects are transitively depended on by a fairly large part of all projects, thus the cost of building such big dependency graph is too high for the limited time. We plan to research more optimized graph search algorithms to speed up the graph analysis.
Extending study to other ecosystems
Our dataset was restricted to the packages within npm. In practice, the JavaScript ecosystem is much larger and there are many other kinds of programming languages in use having their own ecosystems. Reproducing our research study within different ecosystems will reveal vulnerability patterns for popular packages in individual ecosystems. Extending the study to other ecosystems also makes it possible to investigate vulnerabilities in dependencies to heterogeneous ecosystems, which was not covered in our study. Considering such a broad view of dependency chain will further highlight the importance of collective effort for security.
About the team
This product was conceived and developed as part of our coursework for the Fall 2021 class ECS 260: Emperical Software Engineering taught by
Prof. Vladimir Filkov
![]() at the
University of California, Davis
at the
University of California, Davis
![]() . Our team consists of following members:
. Our team consists of following members:
- Vasudha Jha ( vajha@ucdavis.edu )
- Nan Ma ( mnama@ucdavis.edu )
- Parichaya Chatterji ( parichay@ucdavis.edu )
- Jinyoung Pung ( jpung@ucdavis.edu )
- Qifan Ren ( qfren@ucdavis.edu )